by Jerry Robinson | FTMDaily Editor-in-Chief
HOUSTON, May 6
Q: What is the origin of the “Peak Oil” theory?
A: The ‘peak oil’ theory was first advanced by an American geophysicist named Marion King Hubbert. Hubbert was a Shell Oil employee in the oil heydays of the 1950’s. During this era, American oil production was growing rapidly and EROEI (Energy Return on Energy Invested) was high. In many ways, these were the glory days of the American oil business. But on March 8, 1956, a shock wave would strike the calm and prosperous waters of America’s oil industry. That day, at the Plaza Hotel in San Antonio, Texas, M. King Hubbert delivered a speech entitled, “Nuclear Energy and the Fossil Fuels.” In his speech, Hubbert demonstrated that graphs of oil discoveries over time tended to follow a bell shaped curve similar to this one below.
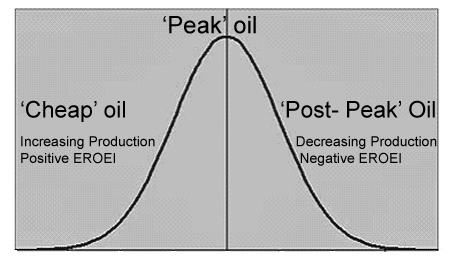
According to Hubbert, all energy production naturally moved through three distinct stages:
- The first stage of a newly discovered energy source is a period of increasing energy production with a high rate of EROEI.
- The second stage occurs when production from the energy source begins to flatten out. It is at this point that production is said to have ‘peaked.’
- The third stage occurs shortly after production has peaked. This period is marked by declining production and a declining rate of EROEI.
But Hubbert did not stop at simply explaining his findings. Hubbert also boldly dared to make predictions as to when the United States would collectively reach its own period of peak production. (He did this despite pressure from his employer Shell Oil. History tells us that the status quo is fiercely defended until the majority demands change.) To the shock and dismay of the American oil industry, Hubbert declared in 1956 that America, as a whole, would reach their peak oil production sometime between 1965 and 1971. He stated that, during this time period, he expected America’s oil production to stop increasing and hit a ceiling, or a “peak.” From that point on, Hubbert’s research indicated that America would enter the third stage of declining production and lower rates of EROEI.
As you can imagine, both Hubbert’s findings and his predictions were greeted by a large amount of controversy in his day. For the most part, Hubbert’s analysis was dismissed as sensational and quickly forgotten. It was not until the 1970’s that Hubbert’s research would be revived by a concerned public.
Hubbert was the first scientist in the oil industry to publicly warn of the threat posed to America by ‘peak oil.’ His research and theories became known as Hubbert’s Peak. (Google “Hubbert’s peak” for more information.)
Q: What proof exists that “Peak Oil” is a valid theory?
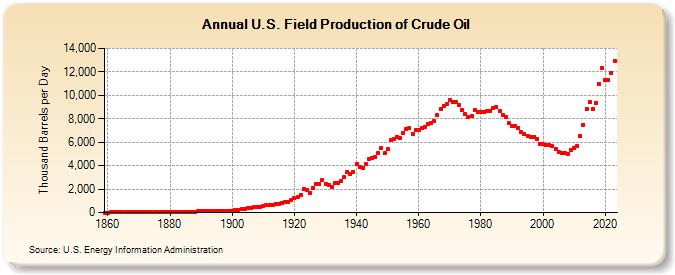
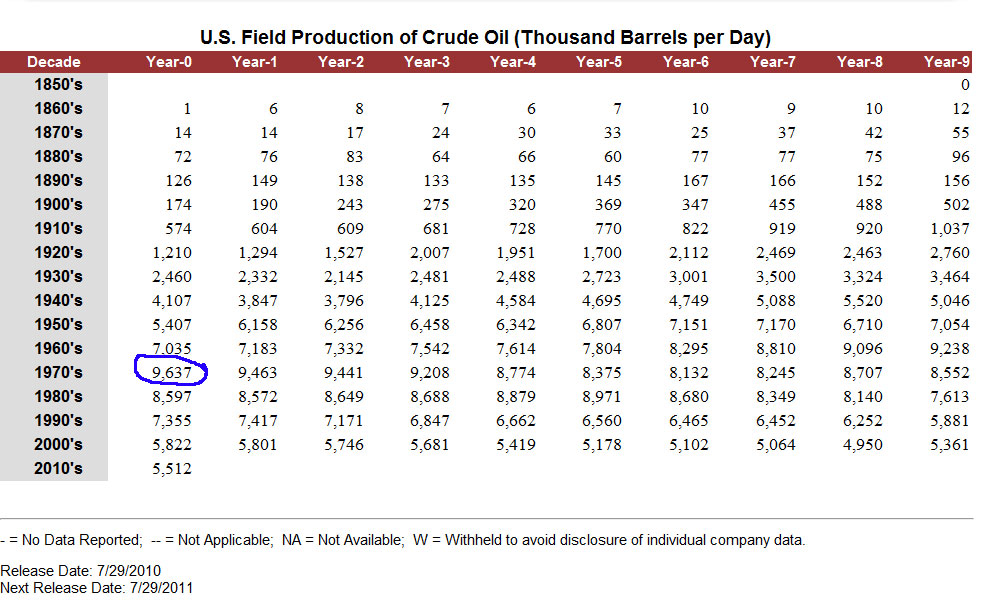
Despite being marginalized by his peers and facing ridicule from the media, Hubbert’s prediction came true in 1970. After decades of increasing oil production and high rates of EROEI, the United States began to enter a period of peak production in the year 1970, when oil production peaked at a rate of 9.6 million barrels per day. One decade later, despite massive efforts to increase production, American oil output declined to 8.6 million barrels per day. Today, U.S. oil production stands at around 5.5 million barrels per day – about half of what it was back in 1970. Did Hubbert accurately predict America’s energy crisis nearly fifteen years before it happened? Examine the graph of America’s daily oil production to confirm Hubbert’s peak for yourself.
Q: If America’s oil production peaked in 1970 and has been declining ever since, how has America been able to feed its own growing demand?
A: Imports from foreign nations.
It is no secret that America is addicted to oil. Our nation’s appetite for oil has been steadily increasing over the last several decades. In 1970, the year of America’s peak oil production, we imported only 24% of our oil from foreign nations. Today, that number has increased to 70%. And it is growing. In fact, each and every day America consumes around 25% of the world’s available oil production. That’s about 18.8 million barrels a day! What makes this number even more staggering is that America only makes up 5% of the global population. This means that the remaining 95% of the world’s population must grow and maintain their economies with only 75% of the world’s oil supplies. Sadly, America’s dependency upon foreign oil has exposed our nation’s obsession with overconsumption. Never before in history has one nation been as dependent upon foreign nations for its own supply of energy as America is today.

You will notice from the above chart that U.S. oil production peaked in 1970 and then began to decline. (Just as Hubbert predicted.) Also notice how sharply imports rose just after 1970. By the mid-1990’s, imports began to outpace domestic production. And by 2005, imports from foreign nations were about twice as great as America’s own oil production.
Based upon this chart, do you think that America’s imports are going to go up or down in the future? This chart makes it clear that some tough choices lie ahead for America.
And here’s how the current global data looks going forward to 2015, based upon known U.S. domestic production and import demand.

On Monday: More Q&A on Peak Oil
Here at FTMDaily.com, we are working hard to create solutions for you during these difficult times of economic crisis. We invite your feedback and comments on how we may serve you better. Feel free to contact me directly at jerry@ftmdaily.com.
In The News Today…
1. GREEK THEATER: Spiegel Online is reporting that Athens is considering withdrawing from the euro zone. The common currency area’s finance ministers and representatives of the European Commission are expected to hold a secret crisis meeting in Luxembourg on Friday night
2. OUT OF WORK: The latest numbers from the U.S. Labor Dept. for the month of April show that the “official” unemployment rate jumped back up to 9%.
3. AG-FLATION: This week’s commodities plunge has done little to dent concerns of continuing food price inflation.
4. GOLD, SILVER UP: Both gold and silver are rising in today’s trading session.
5. HOOSIER PAIN: Indiana residents say record-high gasoline prices are forcing them to park their cars, stay home more often, and ride their bicycles. Average price per gallon in Indiana: $4.25.
Finally…
SHOCK POLL: A new CNN Poll finds that Rep. Ron Paul has the best chance to defeat President Barack Obama in the 2012 Presidential campaign.
Cartoon of the Day…

Until Monday,
Jerry Robinson – FTMDaily.com
____________________________________________________
Jerry Robinson is an economist, published author, columnist, international conference speaker, and the editor of the financial website, FTMDaily.com. In addition, Robinson hosts a weekly radio program entitled Follow the Money Weekly, an hour long radio show dedicated to deciphering the week’s economic news.
You can read the latest
here.