Understanding the Head and Shoulders Pattern: A Key Reversal Chart Pattern
Hey there, fellow traders! Today, we’re diving into the exciting world of technical analysis to uncover the secrets of the Head and Shoulders Pattern. This is a chart formation that can be your ace in the hole, helping you make more informed trading decisions. Don’t worry if it sounds a bit complex – I’m here to break it down into simple terms and show you how to wield its power.
What’s the Head and Shoulders Pattern?
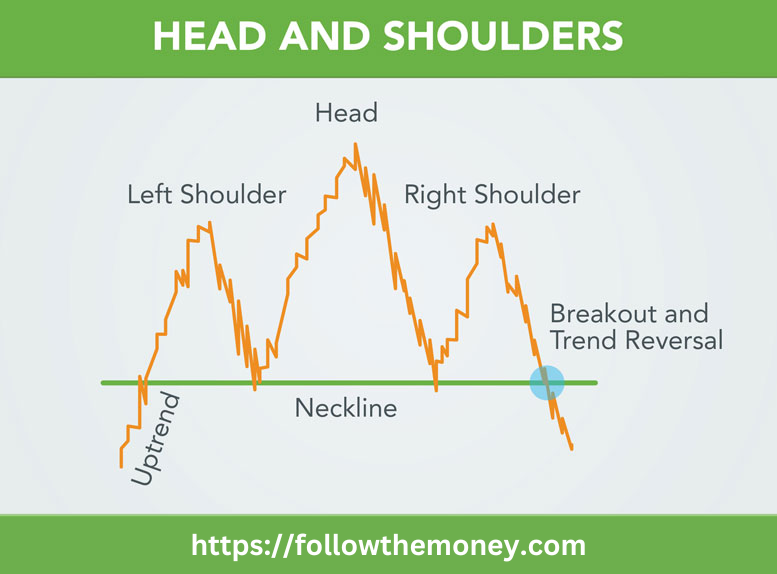
Imagine you’re looking at a price chart, and you notice a series of peaks and troughs forming three distinctive parts – a higher peak (the “head”) flanked by two slightly lower peaks (the “shoulders”). Connect the troughs between the peaks, and voila! You’ve just identified the Head and Shoulders Pattern.
The left shoulder begins to form after an extensive price rally, which almost always occurs on heavier than normal volume. While volume is often strong as the first part of the left shoulder is formed, the last half of the left shoulder, which occurs as prices decline, typically comes on lower than normal volume.
Next, prices rally higher to form the left side of the head, typically on larger than normal volume levels. The decline, which forms the right side of the head tends to come on weaker volume.
Finally, the right shoulder is formed as prices rise, but remain below the peak levels created by the head. The formation of the right shoulder tends to occur on weaker volume levels than the left shoulder or head formation.
What Does it Mean?
The Head and Shoulders Pattern is a powerful reversal pattern and often indicates a shift in the underlying trend. In plain English, it suggests that an uptrend might be coming to an end, and a potential downtrend could be on the horizon. It’s like the market is giving you a secret signal that it’s time to prepare for a shift in direction.
Why is it Important?
As traders, we’re always on the lookout for opportunities to jump into or out of a trend at the right time. The Head and Shoulders Pattern can be your trusty ally in this quest. Identifying this pattern can give you a competitive edge, allowing you to position yourself strategically for potential trend reversals.
How to Use it in Trading?
1. Identify the Peaks and Troughs: The first step is to spot the three distinctive parts – the higher peak (head) between the two slightly lower peaks (shoulders), along with the troughs between them.
2. Draw the Neckline: Draw a trendline connecting the troughs (the “Neckline”). The neckline is discovered by drawing a line across the bottoms of the right and left shoulders and the head. The Neckline acts as a support level for the pattern.
3. Watch for Breakdown: Keep an eye on the price movement around the Neckline. A breakdown below the Neckline confirms the pattern and signals a potential downtrend.
4. Confirmation is Key: A successful breakdown should be accompanied by increased volume. This adds credibility to the pattern’s validity.
5. Measure the Target: Estimate the potential price target of the upcoming downtrend by measuring the distance from the Head to the Neckline and projecting it downward from the Neckline’s breakout point.
Conclusion: Head and Shoulders Chart Pattern
Below is a real example that illustrates this pattern.
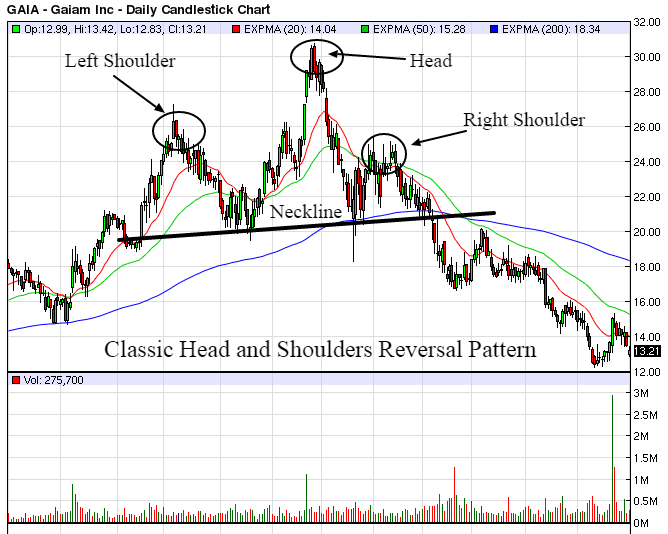
As you can see from this example, the neckline will not always be perfectly horizontal. Nevertheless, when this pattern appears on a chart, there is a good chance that the uptrend is over and a new downtrend is forming.
In conclusion, the Head and Shoulders Pattern can be a valuable tool in your trading arsenal, especially when it comes to spotting potential trend reversals. Combine it with other analysis techniques for a well-rounded approach. So, keep your eyes peeled for those distinct peaks and troughs on your charts, and may they lead you to more profitable trading endeavors. Happy trading, folks!
Until next time,
Jerry Robinson