CHART SCHOOL: The Double Top Chart Pattern
Demystifying the Double Top Chart Pattern: A Trader’s Guide
Hey there, fellow traders! Today, we’re going to dive into a classic chart pattern that can help you spot potential trend reversals – the Double Top Chart Pattern. Don’t let the name intimidate you; I’m here to break it down in simple terms and show you how to harness its power in your trading journey.
What is the Double Top Chart Pattern?
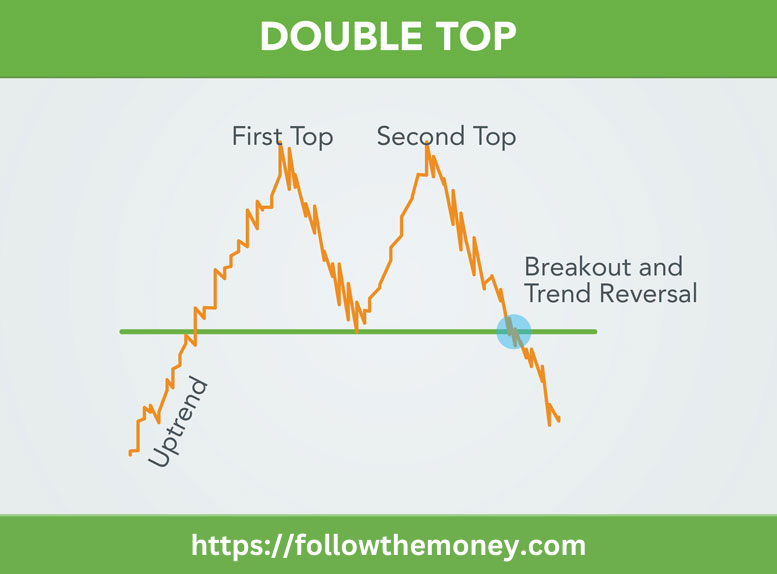
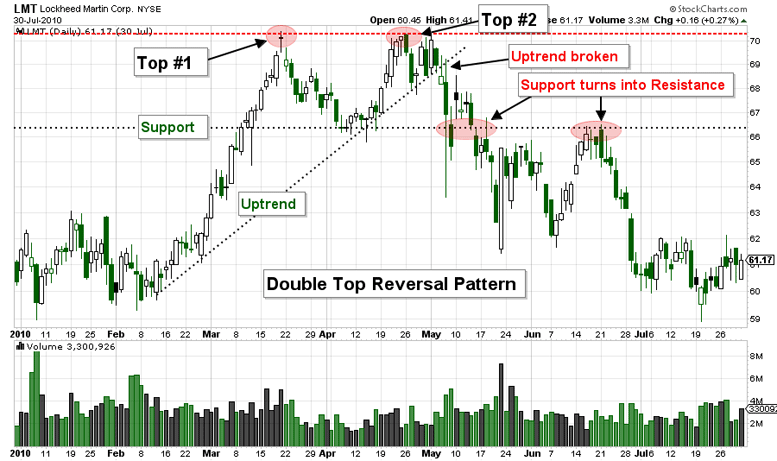
Imagine looking at a price chart and noticing two peaks that reach a similar high level, followed by a decline. These peaks resemble two mountain tops, and the decline in between forms a “valley.” Congratulations, you’ve just identified the Double Top Pattern!
What Does it Mean?
The Double Top Chart Pattern is a bearish reversal pattern. In plain English, it suggests that an uptrend might be losing steam, and a potential downtrend could be on the horizon. Think of it as the market’s way of signaling that the bulls might be taking a break.
Why is it Important?
As traders, we’re always on the lookout for clues about potential trend changes. The Double Top Pattern can be a valuable tool in your toolkit. Recognizing this pattern early can help you make more informed trading decisions and potentially profit from a looming downturn.
How to Use it in Trading?
1. Spot the Peaks: The first step is to identify the two peaks that reach a similar high level. These peaks represent the “tops” of the pattern.
2. Draw the Neckline: Draw a horizontal line, known as the “Neckline,” connecting the lows between the two peaks. The Neckline acts as a support level.
3. Watch for Breakdown: Keep an eye on the price movement around the Neckline. A breakdown below the Neckline confirms the pattern and signals a potential bearish reversal.
4. Confirm with Volume: Volume can provide additional confirmation. A surge in volume during the breakdown adds strength to the pattern’s validity.
5. Measure the Target: Estimate the potential price target of the upcoming downtrend by measuring the distance from the Neckline to the highest point of the pattern. Then subtract this measurement from the breakdown point.
Double Top Pattern
You might come across traders referring to the Double Top Pattern simply as the “Double Top.” That’s perfectly fine – they’re all talking about the same powerful pattern. Different names, same valuable insight!
In conclusion, the Double Top Chart Pattern is a valuable tool for spotting potential trend reversals and making informed trading decisions. Remember to use it in conjunction with other analysis techniques for a well-rounded approach. So, keep your eyes peeled for those mountain-like formations on your charts, and may they lead you to profitable trading opportunities. Happy trading, folks!
Until tomorrow,
Jerry Robinson
 “Daily Economic/Investment Trends for the Savvy Investor”