Unlocking the Potential of the Inverse Head and Shoulder Pattern
Hey there, fellow traders! Today, I want to shed some light on a powerful technical analysis tool that can help you make more informed trading decisions – the Inverse Head and Shoulder Pattern. Now, don’t be intimidated by the name; I’m here to break it down for you in simple terms.
What is the Inverse Head and Shoulder Pattern?
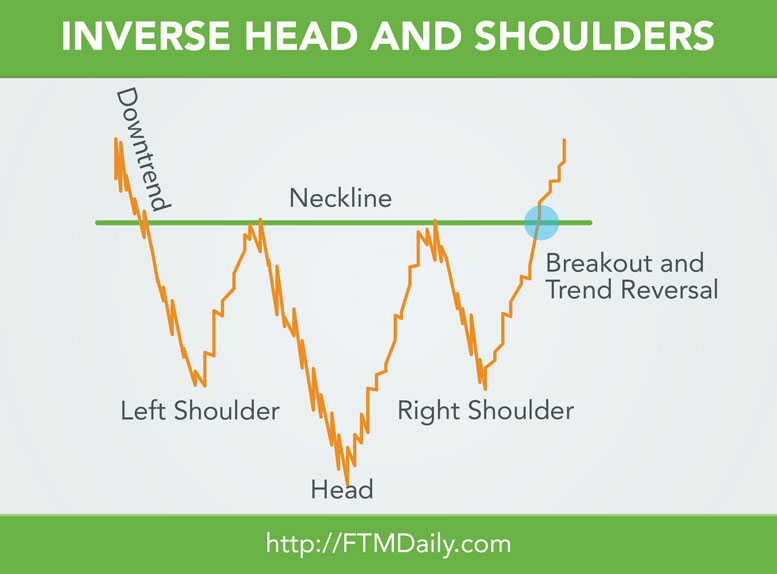
Picture this: you’re looking at a price chart, and you notice a series of peaks and troughs forming three distinctive parts – a left shoulder, a head, and a right shoulder. The middle part, the head, sticks out like a sore thumb as the highest peak. Imagine flipping this pattern upside down, and voila! You’ve got yourself an Inverse Head and Shoulder Pattern.
What Does it Mean?
The Inverse Head and Shoulder Pattern is a bullish reversal pattern. In simple terms, it indicates that a downtrend may be coming to an end, and a potential uptrend is about to kick in. It’s like the market is sending you a little secret signal that it’s time to switch gears from bearish to bullish.
Why is it Important?
As traders, we’re always on the lookout for opportunities to catch a trend early. The Inverse Head and Shoulder Pattern can be your trusty ally in this quest. Identifying this pattern can give you an edge, allowing you to enter the market at an advantageous position before the uptrend gains full momentum.
How to Use it in Trading?
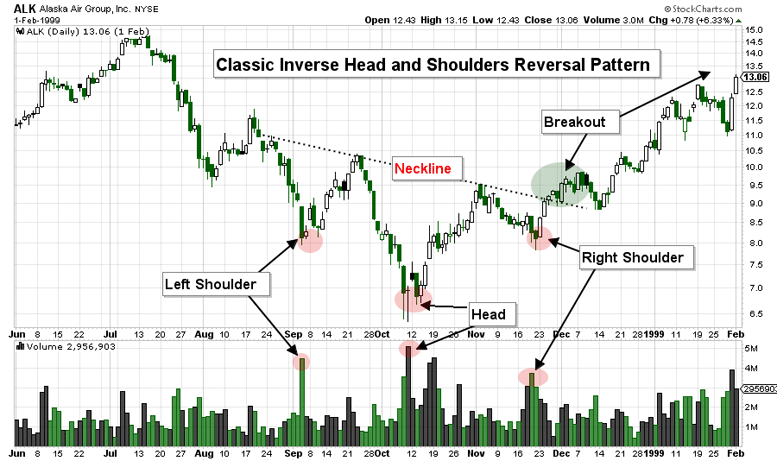
Spot the Setup: First and foremost, you need to identify the pattern. Keep an eye on the peaks and troughs, and look for that distinctive left shoulder, head, and right shoulder formation.
Draw Neckline: Once you’ve spotted the pattern, draw a “neckline” connecting the troughs between the left shoulder and the head and the head and the right shoulder. The neckline should be horizontal or slightly upward-sloping.
Confirmation is Key: The pattern isn’t complete until the price breaks above the neckline. When the price breaks the neckline, it signals a potential bullish trend reversal. But remember, we need confirmation with a convincing breakout!
Measure the Target: You can estimate the potential price target of the upcoming uptrend by measuring the distance from the neckline to the bottom of the head. Once you get the measurement, simply add it to the breakout point from the neckline.
Inverted Head and Shoulders Pattern and Inverse Head Shoulders
By now, you might have heard some traders referring to the Inverse Head and Shoulder Pattern as the “Inverted Head and Shoulders Pattern” or simply “Inverse Head Shoulders.” Don’t worry; it’s the same thing! Different traders might use slightly different names, but it all boils down to the same powerful pattern.
In conclusion, the Inverse Head and Shoulder Pattern is a fantastic tool that can help you spot potential trend reversals and take advantage of early bullish opportunities. It’s not foolproof, but when used in conjunction with other analysis tools, it can significantly improve your trading game. So, keep your eyes peeled for this pattern on your charts, and may it lead you to more profitable trades.
Happy trading, folks!
Until tomorrow,
Jerry Robinson
 “Daily Economic/Investment Trends for the Savvy Investor”