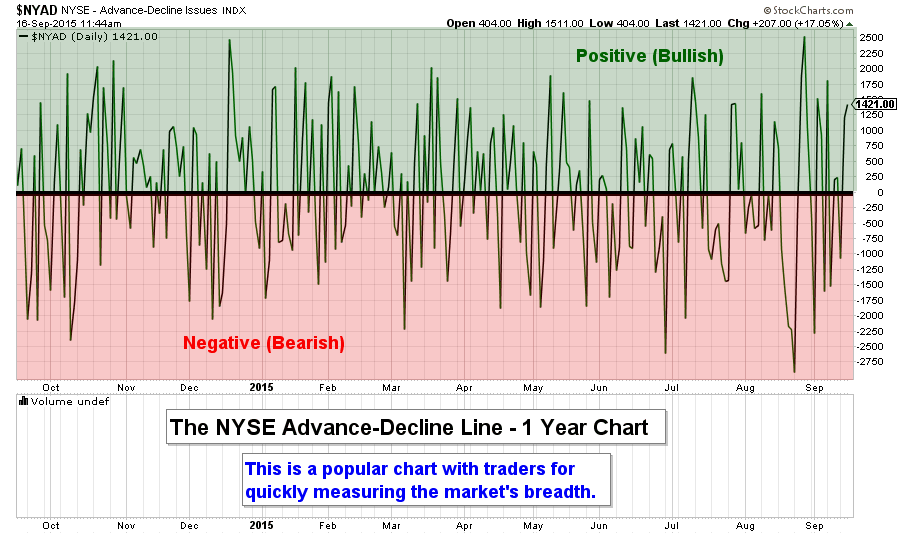
Today, we introduce a new (and very important) chart for astute stock traders/investors: the
Advance-Decline Line.
What is the Advance-Decline Line (ADL)? The ADL is a simple measure of all the stocks on a particular stock exchange that are rising (advancing) less the number of declining stocks on a given day. In essence, if more stocks rose than fell on a given day, the ADL will be positive. If more stocks declined in price than rose on the session, the ADL will be negative.
Technical analysts consider the ADL to be one of the most comprehensive ways to gauge market breadth. (Market breadth is a fancy way of referring to the ratio that compares the total number of rising stocks to the total number of falling stocks.)
The AMEX, Nasdaq and NYSE all have their own advance-decline chart data. In today’s chart, we focus on the largest of the three: the New York Stock Exchange Advance-Decline Line.
Interpreting the NYSE Advance-Decline line is rather simple. When more stocks are rising than falling, the line moves above the zero line, which is considered bullish. Inversely, when more stocks are falling in price than are rising, the line moves below the zero line. This, of course, is considered bearish by traders.
Cheers,
Jerry Robinson
P.S. To unlock our latest ratings on 40 country-specific ETFs, including buy, hold, and sell signals, subscribe to our Gold member community now.