Note from the Editor
We are pleased to introduce Follow the Money’s first Weekly Metals Briefing, a weekly wrap of the latest news and market events that are driving precious metals prices. Each weekly issue will include annotated charts of gold and silver prices to help you become a better metals investor. This new weekly feature is written and produced by Stephen Penny, a precious metals investor and long-time member and student of FTMDaily’s trading philosophy.
Enjoy!
Jerry Robinson
Follow the Money’s Weekly Metals Briefing
By Stephen Penny
(Platinum member & FTMDaily Contributor)
Welcome to Follow the Money’s first Weekly Metals Briefing!
Each weekend we’ll be reviewing where we’ve been and where the data indicates we may be headed. Remember, price and volume are our best leading indicators of future trends and price action, not the talking heads on mainstream media (MSM). This week’s Gold and Silver headlines are often last week’s price and volume.
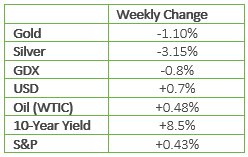
For the week, gold and silver were down $24 (1.1%) and $0.65 (3.15%) respectively, with most of the losses coming after Friday’s better than expected jobs report. The USD was up on the week, closing at $96.17, back above both the 50/200 day Moving Averages (MA). I suppose some believe we may still see a rate hike in September. Consider me skeptical. Oil rallied Wednesday on a bearish Petroleum Status Report. It’s generally bullish when a commodity rallies on bearish fundamental news because this often indicates that all of the “bad news” has already been reflected in the price. Bond yields rose sharply this week from the all-time lows seen last week. The 10-yr Treasury currently yields 1.59%. The S&P closed at an all-time high, and at the high of the session/week, at 2182.
Below is a brief synopsis of several stories, trends and geopolitical factors driving the metals this week.
- Switzerland’s central bank added $7.3 billion to its U.S. equity portfolio, and according to its recently filed 13-F, now holds $61.8 billion in US stocks, up from $54.5 billion a month ago. The Swiss central bank has increased its total U.S. holdings by a record 50% in the first half of 2016. Yes, central banks print money to buy stocks and the Swiss are not the only ones doing it. The massive flows of freshly printed currency units have helped to drive global stock markets to new highs, helping to mask the growing instability in the global monetary system. Gold, silver, and sovereign debt yields are telling a different story.
- Bond-fund manager Bill Gross is shunning stocks and bonds as yields hover near record lows, instead focusing on gold and real estate. Gross voiced concerns about the financial system, economy and persistently low interest rates when he talked up gold in his monthly investment outlook. He joins a growing list of big name institutional money managers becoming bullish on gold. When big money enters the gold market, price and volume tell us long before news stories like this from Bloomberg and CNBC.
- Goldman Sachs was fined $36.3 million for the use and disclosure of confidential materials used by the U.S. in its supervision of banks. The bank is seeking to pin the infraction on Joseph Jiampietro, a former managing director at Goldman. It’s common for the fines levied against large banking institutions to be a small fraction of their actual profit from the illegal activity, and the crimes are often blamed on an individual “rogue trader.” A spokesman for Goldman stated, “We’re pleased to have resolved this matter.” Phew! I’m sure glad it’s resolved and we won’t have to worry about those pesky banks breaking the rules anymore…the rogue trader has been identified and brought to justice!
- In Friday’s jobs report, BLS said the economy added 255,000 jobs in July, a better showing than analysts expected. The July unemployment rate held steady at 4.9% while the more meaningful labor force participation rate – the percentage of people in the civilian population, age 16 or older, who are either working or actively seeking work- reflects a more dismal 62.8% .
- The Bank of England to cut interest rates from 0.5% to 0.25%. The BOE also announced another round of quantitative easing. It will buy £60 billion of U.K. government bonds over the next six months. It will also buy £10 billion of corporate debt over the next 18 months. I’m no rocket surgeon, but it seems to me that central banks will be printing a lot of money going forward and the market is taking notice.
- A five-year strategic cooperation plan was agreed upon between Russia and Iran, and further collaboration in the future was discussed. The sides signed a contract for the construction of a power station in Iran. Russia has already approved a €2.2 billion loan for infrastructure projects in Iran. Needless to say, settlement will not be made using U.S. Dollars.
The above headlines are a small sampling of the economic and geopolitical challenges we face. Tensions between NATO and Russia, war in Ukraine, the Middle East debacle, resource scarcity, over $100 Trillion in unfunded contingent liabilities, negative interest rates, a debt-based fiat monetary system that requires an exponential increase in debt and the money supply, etc. are all fundamental factors that will drive the precious metals higher for years to come. Physical gold and silver stored outside of the banking system is a prudent hedge against this monetary and geopolitical uncertainty. (I’m thankful that, as a Christian, my ultimate hope isn’t with some central banker, political leader…or in gold and silver, but in my Creator.)
With both gold and silver perched above key support and below significant resistance, we’ll examine the charts this week from a long-term, intermediate term, and short-term perspective.
- Ten Year Monthly Charts: Long-Term Trend
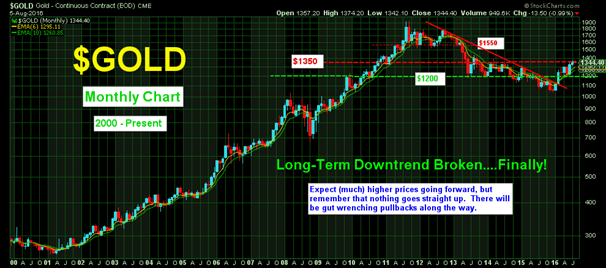
We can now say with a fair amount of confidence that the brutal bear market of the past 5 years has finally come to a close and a renewed bull market is set to resume. So far in 2016, we’ve retaken a lot of lost ground in short order, and gold now sits just below $1350, a level not seen since 2014.
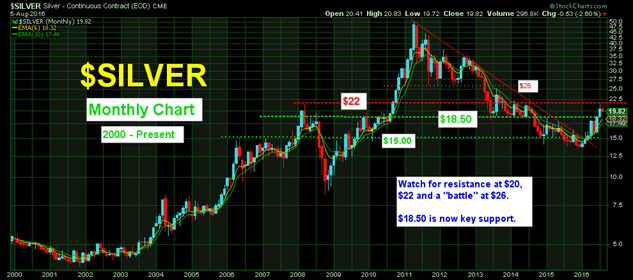
True to form, silver has outperformed gold to the upside in 2016, up nearly 50% on the year.
Retaking and maintaining the $20 level will set up for a test of $22 and an eventual battle at $26.
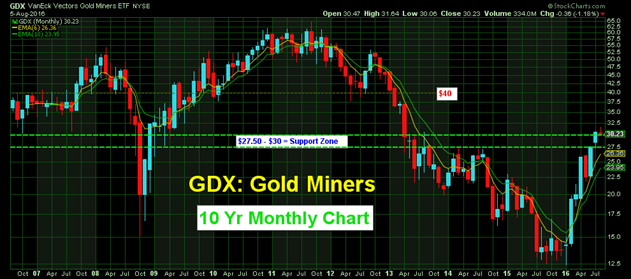
The miners have been on a tear, going from a low of approximately $12.50 in Jan to $30.23 yesterday as measured by the GDX. Not too shabby.
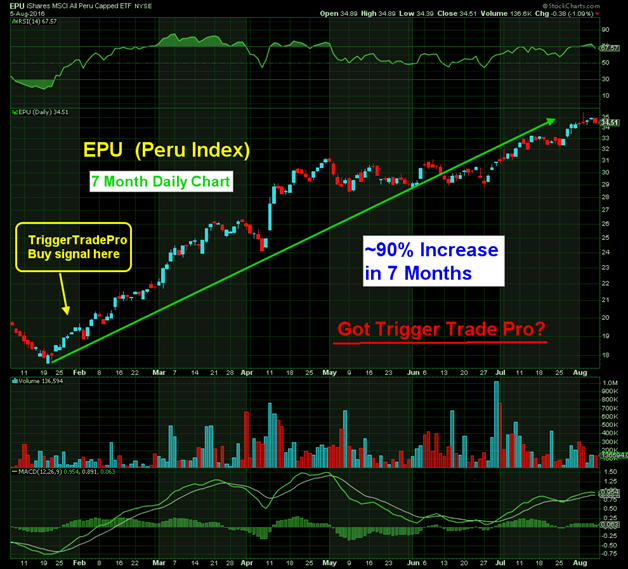
Got Trigger Trade Pro? Our members were alerted at the very early stages of this uptrend and many have profited handsomely.
- Five Year Weekly Charts: Intermediate Term Trend
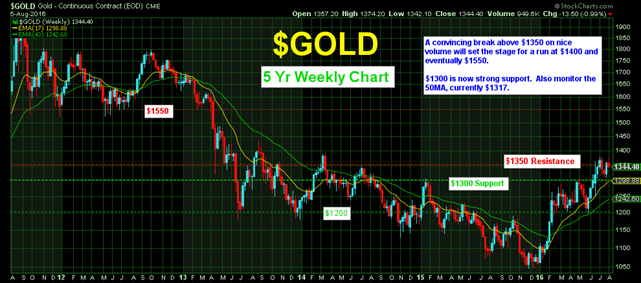
If gold can retake $1350, the next significant overhead resistance is $1400. Expect an eventual battle at $1550, a level that held as support for several years before giving way to the big sell-off in 2013.
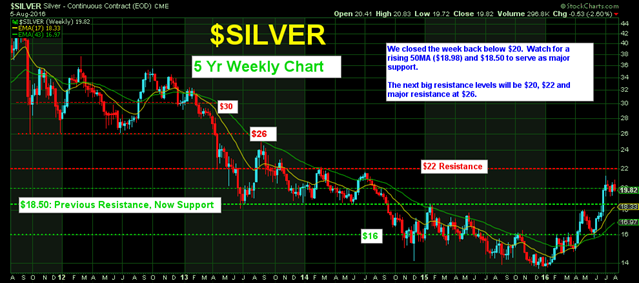
Monitor the $20 and $22 levels as the first lines of resistance. The $26 level will eventually be huge resistance, as that is the level that held for several years before giving way in 2013.
$18.50 previously served as major resistance and is now key support.
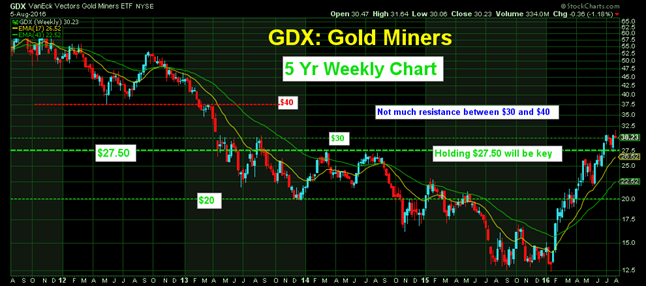
Closing for a fifth consecutive week above the $27.50 level is very encouraging.
Above $30, there isn’t much resistance until the $40.
- Six Month Daily Charts: Shorter-Term Trend
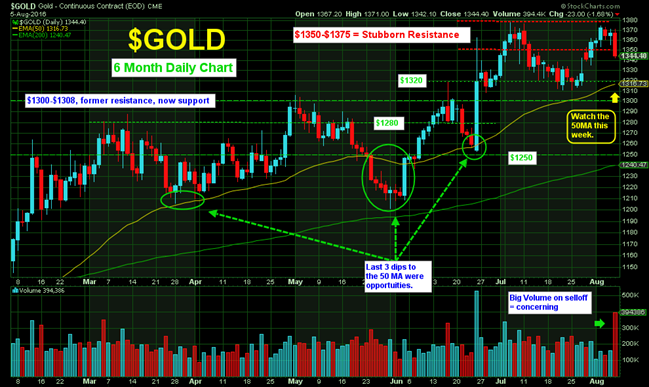
On Friday, gold was sold aggressively, giving back $25 on fairly big volume and falling below the key $1350 level. After a $300 rally over the past 7 months, some profit taking along the way is expected. Closing near the lows of the day is also short-term bearish.
Initial areas of support are:
1) $1320
2) A rising 50MA, currently $1317
3) $1300
For aggressive traders, a daily close above the previous day’s high will be the first sign of a possible reversal. For those more conservative, a close on good volume above the previous daily high at $1375 would provide a safer signal.
For Pro Traders, being able to interact directly with veteran trader Jerry Robinson on our twice-weekly conference calls combined with access to the Trigger Trade Pro software is an absolutely invaluable resource.
On this current rally, every dip to the 50MA has proven to be a buying opportunity. This indicates the presence of institutional money on the sidelines anxious to participate. Think about it; if you were a fund manager, would you want to report to your clients and bosses that you had zero participation in the single best performing asset class of the quarter and year?
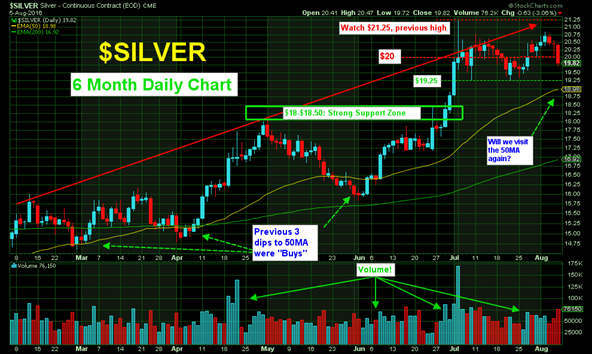
On Fri, silver closed down a chunky $0.59 on above average volume. We’re now back below $20. Initial lines of support are $19.25, a rising 50MA ($18.98) and major support at $18.50. $20 is now initial resistance, followed by the previous high of $21.25.
As a trader, I would love to see a test and subsequent high volume bounce off of $18.50 with a “cleaned out” Commitment of Traders report (reduced commercial short position.) I also wouldn’t mind adding physical precious metals while “on sale.”
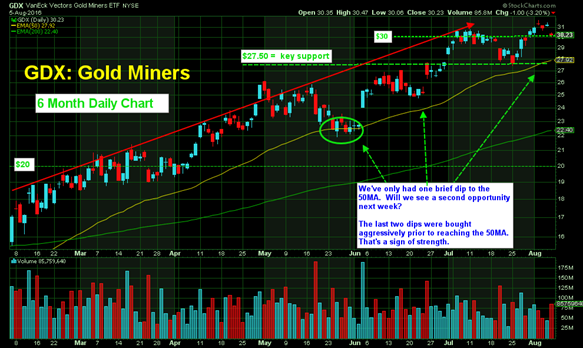
The mining stocks, as measured by the GDX, have only had one retracement to the 50MA since this rally began in late Jan.
Price and volume indicate the presence of big money participation in gold, silver and the mining stocks. These are very small markets, and just a small fraction of the Trillions of freshly “printed” currency units sloshing around the global monetary system could potentially move this sector much further to the upside in short order.
- Moving Average Trends
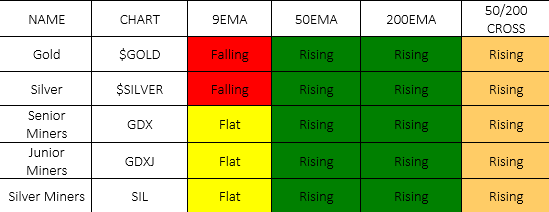
After the BLS jobs report on Friday, the USD rose sharply and the metals and miners sold off. This turned the short-term 9EMA down in both metals. The mining stocks 9EMA went from up to flat. The 50 and 200 EMA are both rising, with the 50MA above the 200MA in both metals and the miners.
- Gold / Silver Ratio
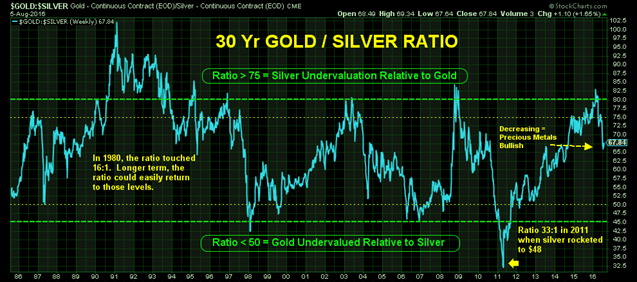
The Gold/Silver ratio continues to plummet, with silver outperforming gold on this run. In early 2016, the gold/silver ratio reached a historic extreme greater than 80:1. One strategy is to swap some gold for silver when this ratio reaches the type of extremes seen in January and swap back when the ratio reaches the opposite end of the spectrum.
It should be noted that currently, global silver mine production is only approximately 9x greater than gold…and silver is consumed in industry. Many prominent metals analyst expect this ratio to eventually reach a ratio of 10:1, or less. If true, silver would greatly outperform gold. Silver is a much more volatile market, so if you’re overweight silver, be prepared for a wild ride.
- Platinum / Gold Ratio
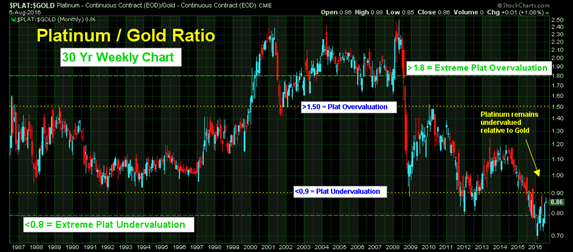
Platinum remains historically undervalued relative to gold. While platinum is almost a purely industrial metal, it has only been this undervalued relative to gold twice in the past 30 years. With the majority of platinum and palladium produced in the geopolitically fragile regions of Russia and South Africa (future supply constraints?), these white metals present a compelling speculative opportunity.
For this anomaly to “correct,” either gold has to selloff more than platinum or platinum will have to outpace gold to the upside. With gold, silver, platinum and palladium in uptrends, the odds favor the latter scenario.
- Mining Stock / Gold Ratio
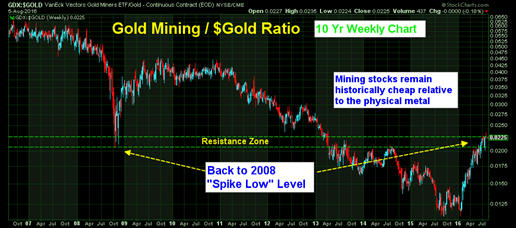
Entering 2016, many of the gold/silver mining stocks were priced for much lower precious metals prices and were at all-time lows relative to gold. Even after more than doubling, the mining stocks remain historically undervalued relative to the actual metal.
Nothing goes straight up, but if history is a guide, the mining stocks should outperform the metals going forward.
- Commitment of Traders Report (CoT) GOLD
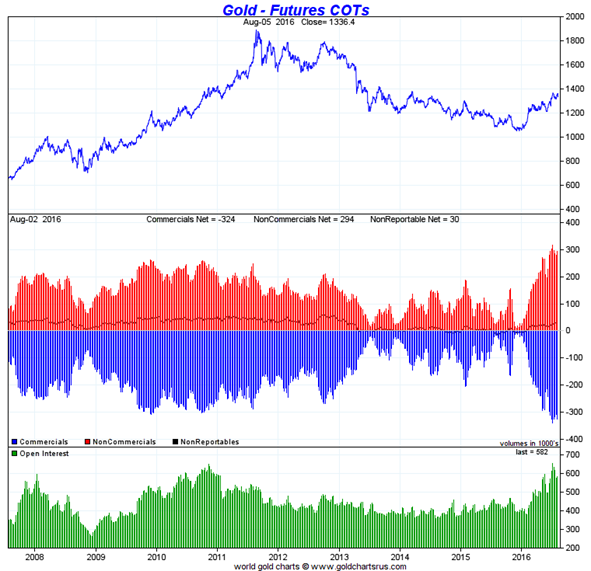
In gold, the Commercial net short position increased by 15,004 contracts (1.5 million ounces.) The Commercial banks are now net short 32.4 million ounces.
Historically, whenever the big banks are this short, a significant sell-off is forthcoming. However, the engineered decline normally would have come weeks ago, and the big banks appear to be on the ropes. The free market is always stronger in the end, and all manipulations eventually backfire.
That said, these banks do not like to lose, and I would not be surprised if they could nudge prices further in their direction. You may recall in 2011, when silver dropped from $48 to $33, that the CME raised silver margin requirements by an unprecedented 84% in 8 days!
SILVER
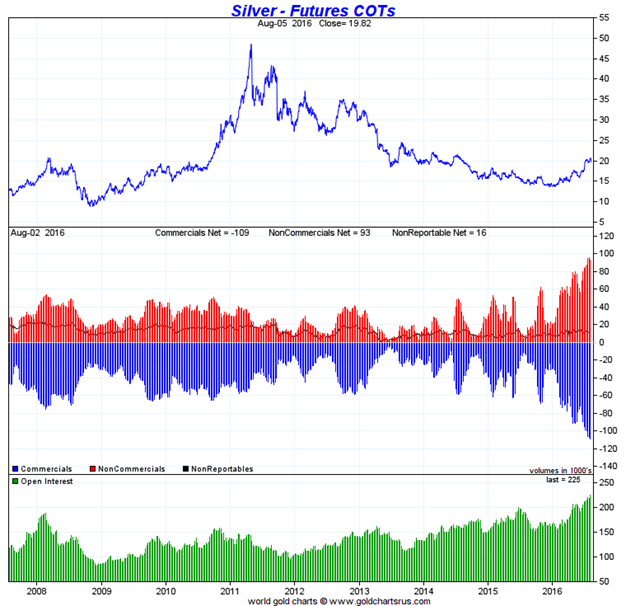
In silver, the Commercial net short position increased by 1998 contracts (9.99 million ounces).
The Commercial net short position stands at a new record high of 545.6 million ounces of paper silver. Remember, the annual global silver supply (mining + recycling) is only approximately 1 billion ounces. So, we have a situation here where a small handful of commercial banks are short over half of global mine supply.
The comments above regarding the Gold CoT apply equally to silver. It will certainly be interesting to see how these extreme futures positions get resolved. If the banks have to cover into a rising price, overhead resistance levels could be pierced like a hot knife through butter.
- Bonus Chart! (EPU)
Summary
In conclusion, it would be difficult to envision a more bullish fundamental picture for the metals. Technically, the intermediate and long-term trends are up and price and volume point to institutional trading algorithms being in “buy the dip” mode.
We’ll have to monitor the charts this week for signs of a reversal and for big money to show up on any further retracement. Although there could still be some more downside, I anticipate dips to be bought, and the uptrend to resume before long. Seasonally, we’re entering the historically strongest months of September through November.
The biggest “fly in the ointment” are the record short positions (bets on lower prices) currently held by the largest banks and Friday’s high volume selloff. These big banks often don’t “play fair” and fight dirty. I know, it’s difficult to imagine banks not playing by the rules. After all, the “rogue trader” has been identified 😉
It’s been a brutal 5 years for precious metals bulls, but the charts indicate higher prices likely await us in the near future!
Have a prosperous week!
Steve Penny (FTMDaily Member and Contributor)
“The chaos that one day will ensue from our 35-year experiment with worldwide fiat money will require a return to money of real value. We will know that day is approaching when oil-producing countries demand gold, or its equivalent, for their oil rather than dollars or euros. The sooner the better.”
– Ron Paul, 2006