Once again it seems we will have to listen to the all-to-familiar partisan bickering over whether or not to raise the debt ceiling. Analysts say the debt ceiling will be reached sometime this fall or winter, with Treasury Secretary Jack Lew
expected to give lawmakers a firm deadline in the coming weeks.
As you can see in the chart below, the national debt now “officially” stands at a whopping $18.1 trillion. (Note the sideways line on the chart in recent months. That’s because the national debt amount has been frozen at $18.1 trillion for at least six months! We’ll have to save that discussion for another day. Suffice it to say that this is known “creative accounting.” Such behavior would send you or I to the slammer. But the Feds get away with bloody murder on a consistent basis.)
Regardless, according to Washington’s “official” $18.1 trillion figure, it breaks down to approximately $57,000 in federal debt per U.S. citizen. So, even if you were to call into one of those AM radio financial shows and scream, “I’m debt free!” you are technically still on the hook for $57,000 thanks to our not-so-budget-friendly politicians in Washington.
source: tradingeconomics.com
Perhaps a greater worry about our spendthrift policy-makers is that many of them point to budget items such as welfare, WIC, food stamps, and other programs for low-income individuals as the budget breaking culprits. In reality, the three largest budget items are Medicare/Medicaid, Social Security, and Defense spending. What the politicians who harp on the “takers” in this economy fail to mention is that, barring cuts to the three aforementioned programs or an increase in revenue (translated: higher taxes), the national debt continues its parabolic lift into the stratosphere.
Since 1940, there have been 95 measures passed to increase the debt ceiling in one way or another. That averages to more than once per year. Chances are that they will have to do it again before the end of this year to ensure the U.S. government can pay the bills it already owes.
Some Republicans are hoping to make this a difficult measure to pass unless Congress defunds Planned Parenthood. That’s in addition to the undeniable battle over spending caps that, if history is any indication of the future, will certainly take place between the two political parties.

Get Our Precious Metals Trend Alerts >>
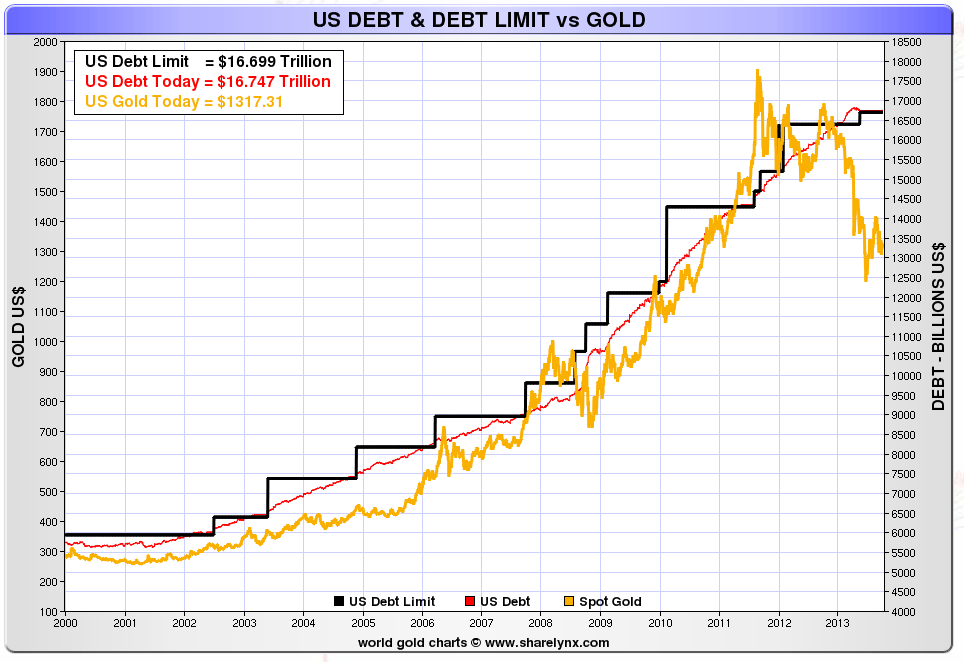
Regardless of where you may stand on the political side of the issue, today’s chart above is an interesting comparison of the price of gold and the debt ceiling.
Notice what often happens when the debt ceiling is raised: gold prices pop. It doesn’t happen every single time, but it certainly warrants a closer look by precious metals investors as we head into yet another annoying debt-ceiling debate.
Until tomorrow,
Jerry Robinson