TRADING EDUCATION SERIES
A BEGINNER'S GUIDE TO TREND TRADINGWhat is Trend Trading?
Trend trading is a momentum-based trading strategy that seeks to buy stocks or other investment vehicles (such as futures, commodities, etc) that are rising in price and to sell them short (or avoid them altogether) when they are falling in price.
The general assumption which underlies trend trading is that a stock will continue moving in its current direction. That is, trend traders assume that a stock in an uptrend will remain in that uptrend until the trend shows signs of reversing, as evidenced by a failure to form a new high.
Unlike some types of traders, trend traders do not attempt to predict or forecast price levels.
They know that no one can predict the future.
Instead, they simply identify and exploit new trends as they develop and exit them when they reverse, or end.
To identify a new buy signal, the trend trader does not rely on the news.
He does not consult the opinions or predictions of a market guru.
In fact, trend traders don’t even rely upon their own feelings or emotions.
Instead, they do rely on a rules-based system and signals generated by the price and volume data available on a stock chart.
Trend traders do not try to time the market by buying at the bottom and selling at the absolute top. Instead, they wait for a confirmed uptrend or downtrend to develop before taking action.
Most trend traders employ stop loss orders, which automatically execute a sell order when the price reaches a level that would signal an end to the current trend. In so doing, trend traders seek to maximize their gains and limit their losses by adhering to the old market adage to “cut your losses short and let your winners run.”
A Brief History of Trend Trading
The idea of momentum-based trading and trading “with the trend” goes back centuries. In fact, that old market adage that I just quoted about cutting losers early and letting winners run was first attributed to the 18th-century economist, David Ricardo. So too, many of the greatest traders throughout the 20th century, men like Jesse Livermore, Bernard Baruch, and Nicolas Darvas, all understood the power of trading with — not against — the prevailing market trend.
However, the modern concept of trend trading (or trend following, as it is also known) as we understand it today really goes back to the commodity trading pits in Chicago. Professional commodity traders have long understood the importance of trading with the trend. In fact, back in early 1980’s, two famous commodity traders, Richard Dennis and Bill Eckhardt, were engaged in a debate over whether trading was a skill that could be learned by the average person. While Eckhardt believed that successful trading was an innate skill only enjoyed by those genetically predisposed, Dennis disagreed and believed that trading was a skill that could be learned just like any other skill.
In 1983, the two traders decided to conduct an experiment to determine who was right. They took out advertisements in major business newspapers, like the Wall Street Journal and Barron’s, seeking apprentices for their study. After being overwhelmed by more than 1,000 applicants, they settled on just a handful of students, whom they called the “turtles.” Each of the students, who reportedly had little to no trading experience, were invited to Chicago for an immersive two-week training on the basics of successful trend trading and were given a small amount of money for trading purposes. Within four years, this small group of traders had amassed more than 80% in compounded gains. And the rest was history, as they say. The experiment had proven Dennis right. Anyone who learned — and applied — the proper methods could succeed as a trader.
Today, trend trading has been recognized as a valid method for profiting from the financial markets. Trend trading is clearly a concept that is here to stay.
What is a Trend?
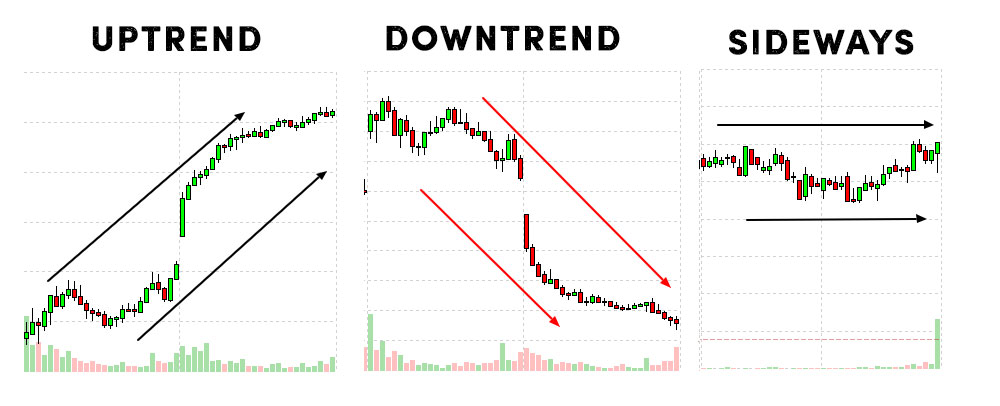
A trend is a defined as the general direction of a market. While trends can be identified in any data set, we are specifically focusing on trends within the stock market. Stock prices can move in only one of three directions: Up, down, or sideways.
How Does Trend Trading Work?
When a stock price is rising, as evidenced through higher highs and higher lows in price, the stock is said to be in an uptrend.
When a stock price is falling, as evidenced through lower highs and lower lows, the stock is said to be in a downtrend.
When a stock price is moving sideways, gyrating between similar highs and lows, the stock is said to be in a period of consolidation or a trading range.
As a trend in a stock price develops, a trendline can be imposed onto the price highs and lows to reveal the direction, as well as the upper and lower bounds, of the trend.
Trend traders seek enter into a long position when a stock is in an uptrend and a short position when a stock is in a downtrend. Trend trading is a strategy that can be used by all types of traders, including short-term and longer-term traders.
Trend Trading Strategies
There is no one-size-fits-all approach to trend trading. There are several strategies employed by trend traders seeking to identify entry points. These include:
Moving Average Strategies – One strategy involves entering a stock when a short-term moving average crosses above a longer moving average and exiting when the short-term moving average crosses back below the longer moving average. Others enter a stock when a stock’s price rises above a particular moving average (especially on stronger than normal volume.) Most trend traders use a combination of moving average strategies and often require a stock’s price to be trading above or below a certain moving average prior to entry. Moving averages are also commonly used as key areas of support and resistance.
Technical Indicators – In addition to price and volume, most trend traders use some combination of technical indicators, such as stochastics, MACD, and RSI, to time their entries and exits. Technical indicators come in many forms and are ultimately used by trend traders to simplify price and volume data. Some track a stock’s momentum while others help the trend trader identify when a stock is oversold, which could serve as a buy signal, or when it is overbought, which would indicate it is time to sell.
Chart Patterns – Another powerful method for identifying new buy and sell opportunities comes in the form of recognizable patterns that appear on the stock’s price chart. While there are literally hundreds of chart patterns that traders can use, most of them have proven to be unreliable. Only a few chart patterns actually have a high accuracy rate, which tend to be the ones most trend traders come to rely on.
Trendline Analysis – One of the most common strategies employed by trend traders is use of support and resistance lines that can be visualized or drawn on a stock chart. Bullish traders use areas of support as potential entry points or for placing stop losses. Meanwhile, bearish traders use areas of resistance as potential entry points and areas of support for stop losses.
The best trend traders use a combination of some or all of the above strategies to increase their probability of making money in the financial markets.
Trend Analysis 101
Trend traders use a form of technical analysis known as trend analysis. Trend traders use past price and volume data to determine where a stock price might be heading in the future. Because trends tend to continue until they are disrupted, trend traders attempt to trade “with the trend” and not against it. I often find that new trading students are surprised at the simplicity of trend trading as it advocates buying stocks that going up and selling stocks that are falling in price.
When conducting trend analysis, most trend traders recognize three types of trends each based on different timeframes. These include short-term, intermediate, and long-term trends. Because each of these trends play an important role in trend analysis by different types of traders, let’s briefly examine them one-by-one.
Short-term trends – These are used by (you guessed it) short-term traders, like swing traders, who seek to hold their positions anywhere from a few days to a few weeks. These trends are best identified on a chart set to a daily timeframe. While short-term traders can benefit from conducting trend analysis on longer-term timeframes, they usually seek to identify their entry and exit points on a daily (or even an intraday) chart.
Intermediate-term trends – Intermediate trends are the go-to trends for position traders, who seek to hold their trades for a period of weeks to months. These longer-term trends are more powerful than short-term trends and are best identified on a chart set to a weekly timeframe. While position traders can benefit from conducting trend analysis on longer-term timeframes, they usually seek to identify their entry and exit points on a weekly chart. Once a signal has been detected on a weekly chart, the position trader will often use a daily (or even an intraday) chart to further refine his entries and exits.
Long-term trends – A new long-term trend, which are identified on a chart set to a monthly timeframe are the most powerful trend signals of all. Long-term trend signals are much more rare than intermediate or short-term trend signals and therefore are of benefit to all traders. Many short-term traders will wisely consider a stock’s current long-term trend before buying in. In fact, I teach my own students that it is best to avoid going long on a stock that is currently in a long-term downtrend, especially if they have a choice of another stock that is in an existing long-term uptrend. Long-term traders and investors will often use the monthly timeframe to identify their trade signals and can use shorter-term timeframes, like the weekly or daily charts to identify a more precise and efficient entry or exit.
How Much Money Can You Make From Trend Trading?
One of the most common questions I receive from new and aspiring traders relates to how much money that they can make as a trend trader. This, of course, is an extremely difficult question to answer as it depends on a wide-ranging number of variables, such as:
– How much trading capital you have
– Your personal level of risk tolerance
– Your personal trading aims and goals
– And much more
Suffice it to say that while an experienced trend trader can earn far in excess of the annual market average returns, new trend traders should focus less on trying to outperform the major stock indices and more upon trying not to lose their trading capital. In fact, this is one of the most important rules for all traders, regardless of whether they are a trend trader or not. Namely, seek to keep your losses to a minimum. Many new traders swing for the fences, fail to use stop losses and then act surprise when they lose half (or more) of their trading capital!
Trust me. Experienced trend traders can make excellent gains from the market. But trading success begins with solid rules. If you are just getting started in trading, let me strongly encourage you to implement some trading rules to protect your trading capital. You can get a free copy of our own top 10 trading rules for new traders here.