Diversify Your Savings
Because diversification is not just for investments anymore
For the past 15 years, I have been explaining the importance of diversification when it comes to your finances. I believe diversification should apply to at least three separate areas of your financial life.
1. Savings diversification (Diversifying your liquidity)
2. Investment diversification (Diversifying your investment dollars across a wide variety of asset classes)
3. Income diversification (Creating multiple streams of income into your financial life)
In Level Three of our Five Levels of Financial Freedom, we teach the need to have six months of liquid savings at all times. That is, six months of your gross income. If you earn $2,000 per month, you should have $12,000 in extreme liquidity at all times. However, simply saving money is not enough. Inflation is a constant threat to your financial plan in any modern fiat monetary system. Since the Federal Reserve can print money at any time, you better believe that inflation will continue to pose a hazard to your finances.
So if you want to dampen the ravaging effects of inflation that cause a loss of purchasing power on your money, diversifying your savings should be a priority. I call this strategy the Diversified Six-Month Liquid Savings strategy, in short, DSL™ Savings.
Liquidity is Key
It is important to remember that the primary goal when choosing a holding place for your DSL™ Savings reserve dollars is liquidity since your DSL™ Savings serves at least two purposes:
- Emergency fund. When you have six months of liquid savings, you won’t need to rely on your credit cards as much when a need for cash arises.
- Opportunity capital. Those who have a ready pool of liquid cash are able to take advantage of opportunities that those without cash cannot.
Here’s What Your DSL™ Savings Reserve is Not
Savings play a vital role in your financial plan, but it is important to distinguish the role of a liquid savings reserve from other roles savings can play in your life. Here are three examples of “other” types of savings roles that should be distinct and separate from your liquid savings reserve:
- Retirement savings. Retirement savings is often not very liquid because you are not going to use it until retirement. An Individual Retirement Account (IRA) or a 401k is a good example.
- Education savings. If your goal is to save for your child’s education, then that money should be separate from your DSL™ Savings reserve so that you will not use it for other purposes. A Coverdell ESA or a 529 Plan is a good example of how you can keep education savings separate as well as get potential tax advantages.
- An Investment. Unlike an investment, DSL™ Savings is a powerful liquidity system that is designed to give you a cushion in times of emergency, as well as to take advantage of special opportunities when they come your way. In our Five Levels of Financial Freedom, we place investing after building a six-month liquid savings reserve.
Over the years, I have run into many people who think saving money is a waste of time or that it is unnecessary. These are usually the same people who rely on credit cards when they get a flat tire and who have to pull money out of their IRA or 401(k) when an emergency arises. Usually, these are also the same people who feel that they need to hit a home run with every single investment. In my opinion, this is a poor lifestyle choice. I prefer to have diversified liquid cash on hand that I can quickly access in case of an emergency or if a great opportunity arises.
Let me make this clear: A lack of liquidity is not an option for the days ahead. You must have access to liquid cash if you are going to create a successful financial game plan.
The Research Behind DSL™ Savings
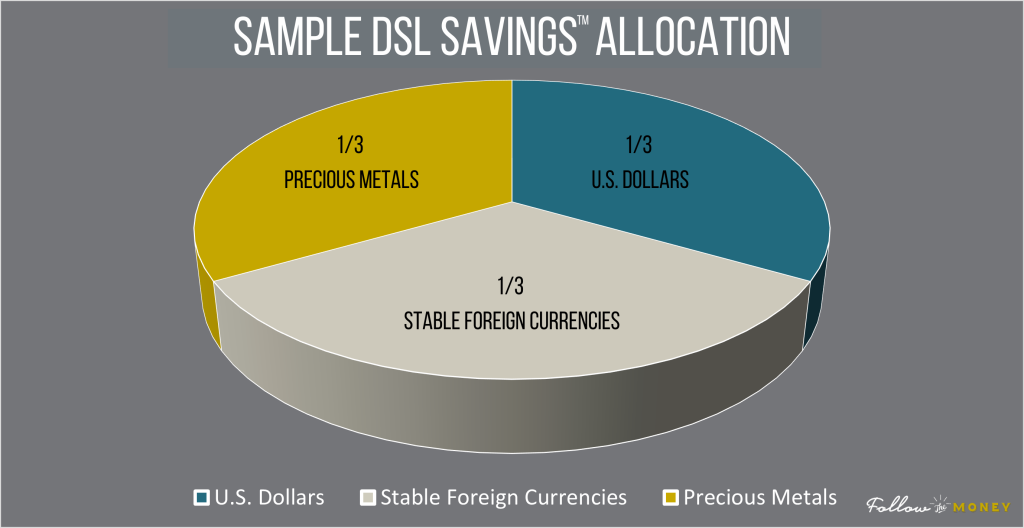
The following describes a sample DSL™ strategy. Let’s assume that you earn $60,000 per year. In order to create your DSL™ savings, you would need to start saving until you have a total pool of $30,000, which is equal to six months of your income. The DSL™ allocation looks like this:
- One-third in U.S. dollars (i.e. savings account or money market account)
- One-third in physical precious metals (i.e. gold and silver)
- One-third in stable foreign currencies (i.e. euros, Swiss francs, Canadian dollars, etc.)
While this is only one possible diversification strategy for your DSL™ savings reserve, I have personally found it to be particularly effective in protecting purchasing power. In fact, we have a study to backtest the performance of this strategy using historical data from the past 31 years.
Our analysts used a starting savings amount of $30,000 allocated as described above and ran the backtest on the following time periods:
- A 5-year backtest (2016 – 2021)
- An 11-year backtest (2010 – 2021)
- A 21-year backtest (2000 – 2021)
- A 31-year backtest (1990- 2021)
The analysts also had a control test for each time period that compared our DSL™ Saving strategy to a typical savings account. In this control test, the savings were not diversified, but rather all savings dollars were placed into U.S. treasury bills receiving the 3-month T-bill rate (which is approximately the rate on an average savings account at a bank). The purpose of the control test was to determine whether a person using DSL™ Savings would have accumulated more money over each time period than a person keeping all their savings in a U.S. dollar-denominated savings account. Our findings were completely stunning.
Scenario #1: What If You Held Your Savings in a Regular Savings Account?
The first results you will see in the table below represent the control group, which used only 3-month Treasury bills. The relevant measure used in our study was the total return on savings not accounting for the negative effect of inflation on purchasing power. Also, all interest earned during a particular year was assumed to be reinvested back into the Treasury bills. The results are shown in the table below.
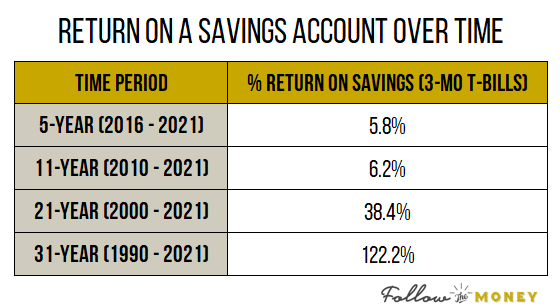
These numbers may look good at first glance, but remember that the returns do not factor in inflation, which has been a formidable eroding factor on money over the 31 years of this study.
How Inflation Erodes Your Savings
To get a feel for how inflation would erode the above returns in a regular savings account consider this. The average inflation rate from 1990 to 2021 was 2.46% per year. In 2021 alone, the inflation rate was 6.8%! You would need about $2.13 in 2021 to purchase what you could have bought for $1 in 1990. In other words, the 122% that you earned by keeping your savings in a regular savings account at the bank for 31 years and never touching it puts you essentially at break-even in 2021. Again, this is assuming that you never pulled any of those savings out during the entire 31-year study.
The total return for the other three periods (21 years, 11 years, and 5 years) was, of course, drastically less due to having less time to compound the interest, but inflation did not go away. Let’s consider the below comparison on the actual return on a savings account and the return after inflation. Suddenly, that compound interest on a savings account doesn’t look so great anymore!
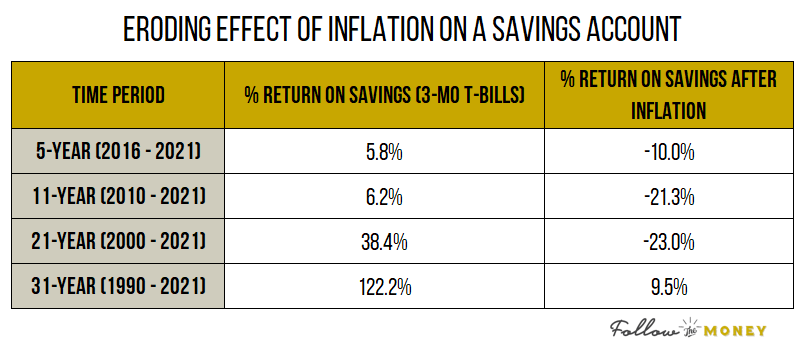
Notice that the only positive return (9.5%) occurred in the 31-year time period, from 1990 to 2021. The compounding effect over 31 years was able to keep the saver barely afloat, outpacing inflation by just under 10%. The total return for the other three periods, on the other hand, was negative. How can this be? Simply put… inflation. Inflation is a major eroding factor on money, and although the savings dollars were earning interest, it was counteracted by the eroding effects of inflation, which actually caused the purchasing power of the savings account to fall below the original principal amount in real terms. You can see for yourself how the value of a dollar erodes over time due to inflation with this handy inflation calculator.
Scenario #2: What If You Held Your Savings Using Our DSL™ Savings Strategy?
We backtested our DSL™ Savings Strategy to determine how it held up under the same time periods. Remember, the DSL™ Savings represents six months of your gross income and is allocated according to the following model:
- One-third in 3-month T-bills (reinvested at maturity)
- One-third in precious metals (equally divided between physical gold and physical silver)
- One-third in stable foreign currencies (equally divided among the Swiss franc, euro, and Chinese yuan*)
As in the savings account results above, we will show the total percentage returns for the DSL™ Savings for the four different time periods and assume that the interest on the 3-month T-bills is reinvested each year. We will also show the DSL™ Savings returns after inflation.
As a bonus study, we will show the returns on the DSL™ Savings with a very small portion (5%) being allocated to Bitcoin. See the Bitcoin section below for more on those astounding results.
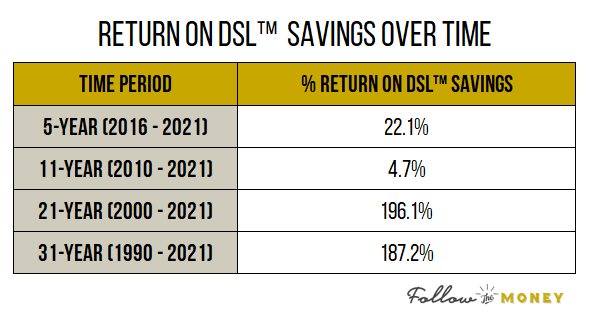
As you can imagine, we were stunned by the above results. We found that the return on DSL™ Savings was well above the return on non-diversified savings (a.k.a. a regular savings account) in three of the four time periods. In only one of the time periods (2010 to 2021), the return on DSL™ Savings was just a percent and a half lower.
Diving Deeper into the DSL™ Savings Results
Let’s dive a little deeper and take the 21-year time period from 2000 to 2021 as our example. You can see in the table below that the return on a regular savings account was 38.4%, whereas the return on the DSL™ Savings strategy was 196.1%. That’s a difference of 157 percentage points from simply diversifying into alternative savings assets!

What makes the returns so much higher than a regular savings account (except for the 11-year period)? One reason is that we are using the traditional inflation hedges, gold and silver. In times of inflation when dollars become less valuable, the prices of gold and silver typically rise. For example, in our 31-year time period, we allocated one-third, or $10,000, to gold and silver. Over 31 years, the dollar value of those metals rose to over $52,000. That is a 424% return!
Another reason for the outsized returns on the DSL™ Savings was the foreign currencies, although they did not impact the overall returns to the degree precious metals did. In the 21-year time period, we allocated one-third, or $10,000, equally among the euro, Swiss Franc, and Chinese yuan. By the end of 2021, the dollar value of the foreign currencies rose to $14,810, which is a sizeable 48% return.
Conversely, our diversification held us back slightly in the 11-year time period. The culprit? It was the precious metals again, which started the time period (in 2010) at historically high levels. Therefore, the saver was not able to purchase as many ounces of gold and silver. For example, our saver was able to purchase over 12 ounces of gold at $391/oz and 1,193 ounces of silver at $4.19/oz in 1990, but in 2010 the saver could only purchase 3.5 ounces of gold at $1,410/oz and 163 ounces of silver at $30.63/oz.
Does Inflation Erode Your DSL™ Savings?
As we saw in the non-diversified savings results above, inflation is a devastating force upon savings in U.S. dollars. For example, in the 5-year study from 2016 to 2021, a saver who earned just over 5% in a savings account during that time would actually have less purchasing power than he or she did at the beginning. Why? The 5% cumulative growth did not even come close to overcoming the inflation rate during those same 5 years.
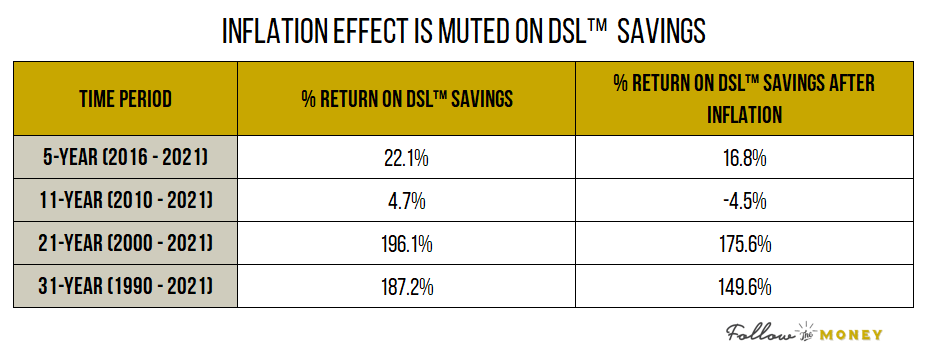
Diversified savers, on the other hand, would not have the same devastating force bearing down upon their money because only one-third of their savings were in inflation-prone, U.S. dollar-denominated savings accounts. Take a look at the table below, which shows how inflation affected the ending amount of money in our four different time periods. As you can see, inflation certainly has an eroding effect, but it is muted compared to how devastating the effect is on non-diversified savers.
How Does the DSL™ Savings Method Stack Up Against Regular Savings
To further visualize the difference diversification makes in your savings dollars, we have summarized the results in the following charts and graphs. Just see for yourself how our DSL™ Savings method stacks up against a regular savings account.
The below chart shows the total return after inflation of the DSL™ Savings (shown in yellow) as compared to a regular savings account (shown in gray). You can see the returns for the four different time periods.
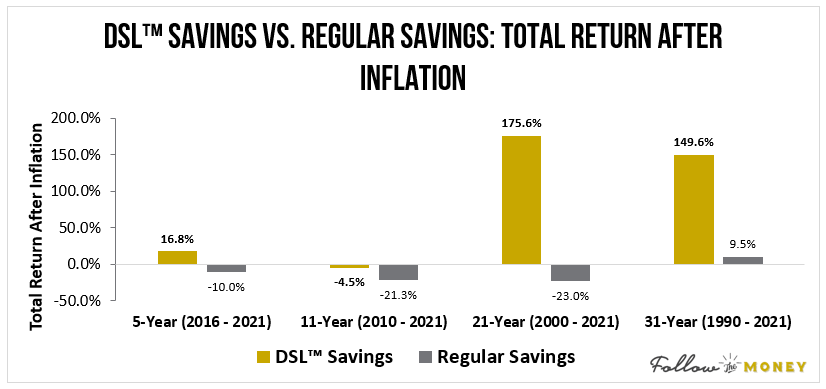
As seen in the above chart, the longer time periods show the greatest difference in returns because you would have more time to grow and compound your holdings. It is astounding (and rather depressing) to see that in three of the four time periods, a regular savings account is actually losing money in real terms because of inflation. The “good old days” of being a good saver and relying on bank interest are clearly a thing of the past. With chronically low interest rates, coupled with rising inflation, traditional savers have sadly become the losers of the 21st century economy.
Finally, let’s consider the results of the study from one more angle: the total dollar amount accumulated in savings. Check out the below charts comparing the dollar amounts accumulated over four time periods in our DSL™ Savings and in a regular savings account.
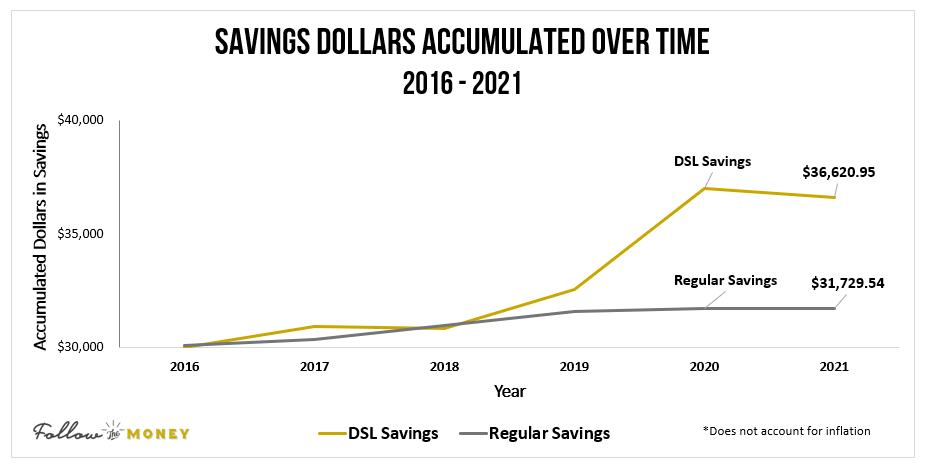
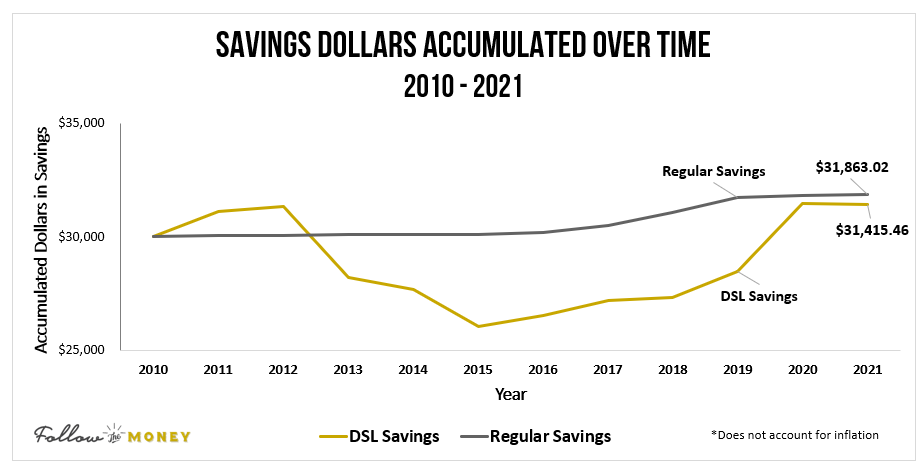
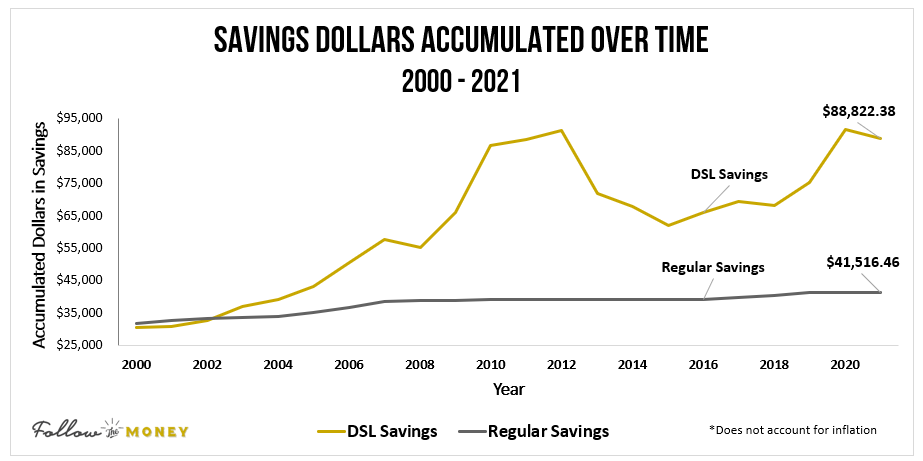
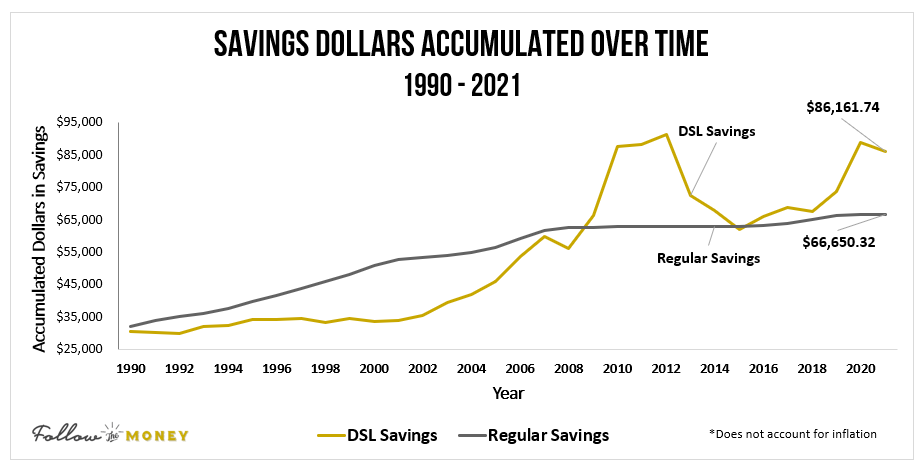
The above charts show the total dollar amount in both savings strategies each year over the given time period. These charts do not account for inflation because we wanted to show the sheer dollar amounts (or dollar value) of the different strategies.
Bonus Study: Adding Bitcoin to the DSL™ Savings Method
In 2008, a now-infamous white paper was released by Satoshi Nakamoto that outlined his vision for a digital cryptocurrency called Bitcoin. In this white paper, Nakamoto pointed out the broken fiat money systems (like the U.S. Dollar) which allow government central banks to print money at will and out of thin air. This permission slip to continually increase the money supply is ultimately what causes inflation to erode away at the hard-earned savings of citizens (as shown above in this study).
Fast-forward to the present, and Bitcoin has indeed become a store of value asset that has historically beaten inflation. In this bonus study, we are going to cautiously incorporate Bitcoin into our DSL™ Savings. Since Bitcoin has only been in existence since 2009, and its price is highly volatile, we are going to limit our exposure to Bitcoin to 5% of our DSL™ Savings, or $1,500 ($30,000 total DSL™ Savings x 5%).
Furthermore, we only performed the Bitcoin study on the 5-year timeframe. While it was technically possible to perform the study on the 11-year timeframe, we determined that it was not very realistic or relatable to most people, mainly because only a sliver of the population had ever heard of Bitcoin in 2010 and because buying Bitcoin in its early days was essentially restricted to those who were highly tech-savvy.
For this bonus study, our DSL™ Savings of $30,000 was allocated according to the following model:
- One-third in 3-month T-bills (reinvested at maturity)
- One-third in precious metals (equally divided between physical gold and physical silver)
- One-third in currencies. Five percent of total DSL™ Savings ($1,500) went into Bitcoin, and rest of this third went into euros
Bonus Study Results: How Did 5% in Bitcoin Affect Our Savings?
The results of the bonus study were nothing short of astounding. Below, you can see the total dollar amount of the DSL™ Savings, which contained only a 5% allocation into Bitcoin, over the 5-year time period. The total savings dollars soared from a starting value of $30,000 to $138,596 in just five years! In addition, the total savings dollars never experienced an end-of-year balance of less than the starting value of $30,000 during the duration of the study.
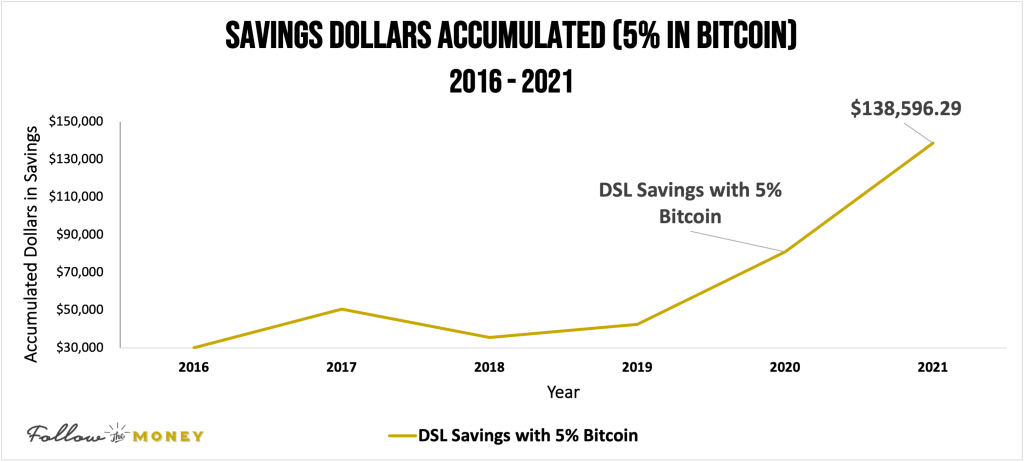
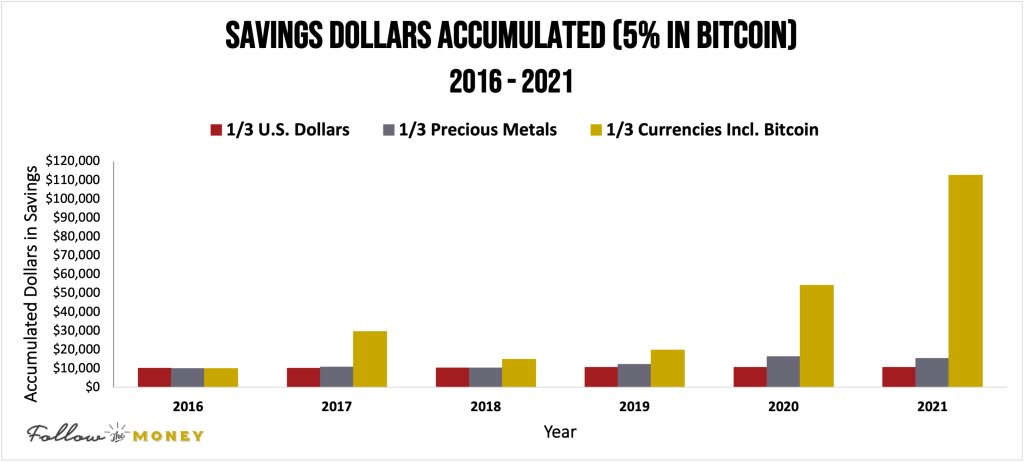
The driving factor in these results is, of course, the 5% allocated to Bitcoin. In fact, you can see below the breakdown of each year in the study according to the asset allocation. You can see that the portions allocated to U.S. dollars and precious metals grew over time, but that growth pales in comparison to the portion allocated to currencies, primarily due to the 5% in Bitcoin. The price of Bitcoin at the start of the 5-year study was $768/BTC (meaning we could purchase 2 bitcoins with our 5% allocation), and in 2021 at the end of the study, the price of Bitcoin had soared to over $65,000/BTC. That is a whopping 8,493% return!
Dissenters might be inclined to assert that these results are unattainable, that this study is great in hindsight, but who could have actually done this with their savings starting in 2016. However, those who have been following our work know that we brought Bitcoin to the attention of all our readers and listeners in 2013, encouraging everyone at the very least to educate themselves by purchasing a bitcoin (yes, a whole bitcoin!).
The Bottom Line
In conclusion, our backtest study on the DSL™ Savings strategy shows that this strategy, when compared to holding all your savings in a regular savings account, is a historically viable method to keep your savings diversified while highly liquid, and also to preserve capital and stay ahead of inflation.
Remember: Savings Is Not The Same As Investments
It is important to remember what the DSL™ Savings strategy is, and what it is not. It is a savings strategy. It is not an investing strategy. Thanks to decades of poor financial education in America, most Americans do not understand the important difference between investing and saving. They are entirely different topics and should be treated as such.
The astounding returns in Bitcoin, for example, could lead one to consider placing all his or her savings into Bitcoin. If it will grow my savings by thousands of percentage points, why not? First, that would not be wise diversification; and second, that would be considered a risky investment (not savings). Investing strategies come into play in Level Four (you’re almost there!), but for now, our top two priorities with our savings are to preserve capital and to stay ahead of inflation.
This brings us to our second important factor to remember: past performance is not necessarily indicative of future performance. While history shows that similar results to our study can continue over time, we cannot forget that we are taking on slightly more risk with the DSL™ Savings strategy than a regular savings account.
Final Thoughts
Based on historical data, diversifying can protect your savings from the eroding power of inflation and can even help grow your savings on an after-inflation basis.
Here at FollowtheMoney.com, we performed our very first backtest study on the DSL™ Savings strategy back in 2010 as we were implementing and developing the strategy in our own financial lives. We were completely shocked by the results. In fact, when we first saw them, we demanded that they be re-checked for accuracy. But sure enough, the returns were real. And while we certainly hoped (and expected) our DSL™ Savings strategy system would outperform a typical savings account, we did not expect it to even outperform many investments during comparable time periods!
Now that we have updated the backtest study to include data through 2021, we continue to be thoroughly pleased with the results. We continue to implement the DSL™ Savings strategy in our own financial plan, and we encourage you to learn about it too. All it takes is a little bit of diversification, self-control, and patience, mixed with a determination not to confuse your savings with your investments.
And that’s it. No secrets, no magic tricks, and no late-night infomercial gimmicks (although that last one would have been fun.) Just plain vanilla diversification. Isn’t it amazing how just a little bit of diversification can make such a big difference!
*The 31-year study did not include euros since the first available exchange rate data for the euro is in 1999. Therefore, the 31-year study (1990-2021) used the Swiss franc, Canadian dollar, and Australian dollar (equally weighted) for the one-third portion in stable foreign currencies.
The Checklist
Before proceeding to the next step, be sure that you:
- Consider diversifying your savings if you believe inflation can erode your purchasing power
- Consider using precious metals and/or stable foreign currencies in addition to a regular savings account (and limit Bitcoin to no more than 5% of your total savings if you choose to use it)
- Remember that precious metals, foreign currencies, and cryptocurrencies have inherent risk, and be willing to accept that risk if you choose to hold these assets with your savings
- Learn how and where to buy precious metals
- Learn how and where to buy stable foreign currencies
When you complete this step, you are now ready to advance to Level Four. Congratulations!
More Resources from Follow the Money:
- Beginner’s Guide to Investing in Precious Metals
- 4 Examples of Stable Foreign Currencies and 3 Easy Ways to Buy Them
- Weekly Precious Metals Market Update
- Global Currency Rankings (updated weekly)
- Bitcoin 101 Video