ETF Uptrend Model Portfolios
Keeping members on the right side of the trend. Updated weekly on Fridays.
Members-Only Resource
Thanks for stopping by! We’d love to share our model portfolios with you. Give our membership a try, and get instant access. Learn more here.
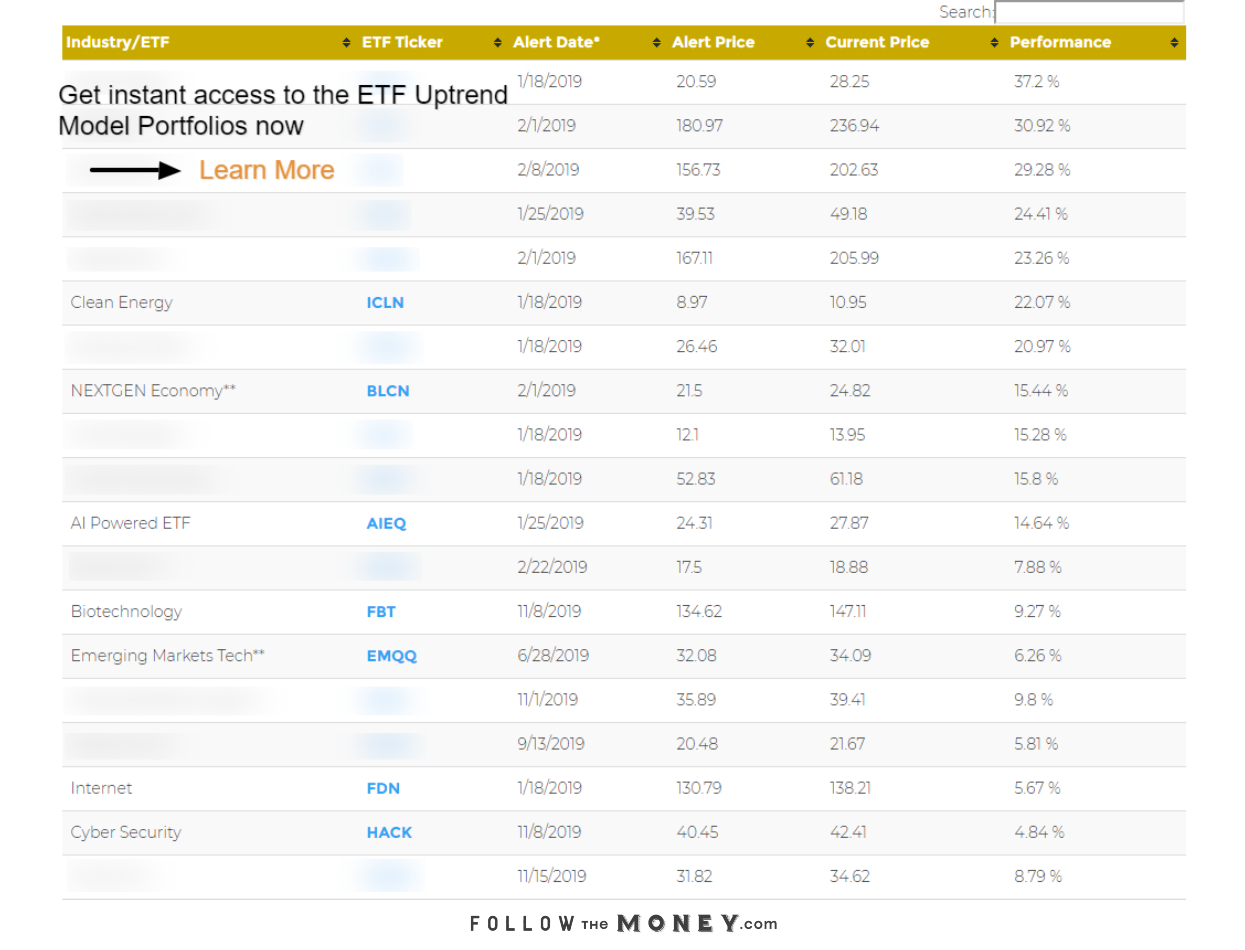
Below is a partial view of our Trailblazer ETF Model Portfolio.
If you are already a member, login here.
Trailblazer ETF Model Portfolio
Frequently Asked Questions (FAQs)
What are ETFs?
ETFs, or Exchange Traded Funds, are securities that track a stock index, commodity, sector, industry, or basket of assets. ETFs hold securities that are pooled into a single entity whose shares can be purchased on a stock exchange similar to a stock. Each share of an ETF gives a trader or investor a proportional stake in the total assets of the exchange-traded fund.
Here are a few examples. SPDR Gold Trust (ticker: GLD) is an ETF in the precious metals category, specifically in gold. GLD seeks to reflect the performance of the price of gold bullion. Invesco Preferred (ticker: PGX) is an ETF that invests in U.S. preferred securities like CitiGroup and AT&T. And the SPDR Euro Stoxx 50 (ticker: FEZ) is an ETF that seeks to mirror the returns of the popular European index, the EURO STOXX 50.
ETFs have many similarities to mutual funds, although there are two major differences. First, ETF shares trade like common stock on an exchange. Second, the price of an ETF’s shares changes during the market day as they are bought and sold. Similar to mutual funds, ETFs have costs associated with them called the expense ratio. For example, the precious metals ETF, GLD, has an expense ratio of 0.40%, which means that it will cost the investor $4.00 in annual fees for every $1,000 invested in GLD.
New ETFs are constantly being approved and introduced on the stock exchanges. One major note of caution to traders: many new or niche ETFs can have very thin volume and therefore may be illiquid.
What is the difference between Position and Long-Term uptrends?
Position Uptrends are upward trending stocks or ETFs in which the uptrend generally lasts between one month and 18 months. Position trends are considered medium-term trends. For example, a recent position uptrend in the US Natural Gas ETF (ticker: UNG) lasted 2.5 months and the potential profit was +52%. Position Traders, therefore, seek to profit from Position Uptrends. They will view the Position Uptrends we provide when conducting their research.
Long-Term Uptrends are upward trending stocks or ETFs in which the uptrend generally lasts between 18 months and 5 or more years. Long-term trends are longer than position trends. For example, a recent long-term uptrend in the S&P Technology Sector ETF (ticker: XLK) lasted 22 months and the potential profit was +79%. Long-Term Traders, therefore, seek to profit from Long-Term Uptrends. They will view the Long-Term Uptrends we provide when conducting their research.
It is possible that a trader can fit into both the Position Trading and Long-Term Trading categories. They are not mutually exclusive. When seeking Position Uptrends in the Profit Trakker software, always use the Position Trade View. When seeking Long-Term Uptrends in the Profit Trakker software, always use the Long-Term Investor View. The trends may be greatly different for one given stock or ETF in the various time views.
What is the criteria for adding or deleting an ETF from the model portfolios?
Adding an ETF. When an ETF enters into a Position Uptrend, it is added to the Model Portfolio for Position Traders. When an ETF enters into a Long-Term Uptrend, it is added to the Model Portfolio for Long-Term Traders. It is that simple!
Deleting an ETF. When an ETF’s Position Uptrend ends by either entering into a neutral trend or a downtrend, it is deleted from the Model Portfolio for Position Traders. When an ETF’s Long-Term Uptrend ends by either entering into a neutral trend or a downtrend, it is deleted from the Model Portfolio for Long-Term Traders. It really is that simple!
Please refer to the FAQ entitled “How is an Uptrend determined?” for details on how we determine uptrends using our system.
How is an Uptrend determined?
Uptrends are determined by our proprietary Profit Trakker software. The Uptrends are based solely on technical indicators, including the Tripwire, Trigger, and Confirmation #1.
The Position Uptrends are determined by using the Position Trade View in the Profit Trakker software. The Long-Term Uptrends are determined by using the Long-Term Investor View in the Profit Trakker software.
Want to determine the trend on any stock or ETF? Use the Profit Trakker software, which is included in the Gold and Platinum membership plans.
How often are the model portfolios updated?
Each ETF Uptrend Model Portfolio is updated weekly on Friday. Look for the date stamp at the top of this web page to determine the exact date of the latest update.
Any changes to the model portfolios will also be posted in the weekly issue of The Robinson Report (available in any of our membership plans).
*What does the low volume warning mean for an ETF?
If an ETF is listed with an asterisk (*), it means that the ETF trades with very low volume. Typically, we consider an ETF to be “low volume” if its 3-month average daily trading volume is less than 150,000.
So, what exactly does this mean for you? First, we do not trade any stocks or ETFs with low trading volume, ever. We prefer to be able to trade in and out of a position at or very near the market price. With low volume stocks or ETFs, you run the risk of not being able to sell your shares without a large spread (above the market price) to the market makers. In other words, you would receive much less than the market price for selling your shares.
So, why exactly would we include a low volume ETF in the model portfolios if we have no intentions of ever buying that ETF? We include low volume ETFs because they provide an excellent way to track the trend in a particular market, sector, or industry. For example, the Silver Miners ETF (ticker: SIL) is a low-volume ETF that we track in the model portfolios. Once SIL enters into an uptrend, we will add it to the model portfolio. Because the silver mining industry is now in a confirmed uptrend, we may begin looking at trading one or more of the top-ranked stocks in the silver mining industry. However, we would not trade the SIL ETF due to its extreme low volume.
What are the Alert Date and Alert Price in the Open Portfolios?
The Alert Date is date on which we identified the beginning of the uptrend in the ETF.
The Alert Price is the market price of the ETF on the Alert Date (the date on which we identified the start of the uptrend).
How is the Performance % calculated in the Open Portfolios?
The Performance % is calculated using the Current Price (current market price of the ETF) and the Alert Price (see Alert Price FAQ for more).
We subtract the Alert Price from the Current Price, and then divide the result by the Alert Price.
(Current Price – Alert Price) / Alert Price
What is the Sector Ranking listed in the Sector Open Portfolios?
The Sector Ranking is a ranking of all the ETFs listed in the Sector ETF Open Portfolio. We list this ranking so that traders and investors get a better understanding of the general market and sector conditions and trends. For example, if defensive sectors like Utilities (XLU) and Real Estate (XLRE) are rising in the rankings, this typically means that the overall economy is shifting toward a more defensive (and perhaps bearish) outlook. If, on the other hand, sectors like Technology (XLK) and Consumer Discretionary (XLY) are rising in the rankings, the overall market and economy has taken an aggressive outlook on growth.
The Sector Ranking score is based on an algorithm for sector strength. The number of ETFs in the Open Portfolio at any given time is the number of ETFs we rank. For example, if there are seven ETFs in the Open Portfolio, those seven ETFs are ranked in order from 1 (Greatest strength) to 7 (Least strength).
You can also use the handy column entitled “Change in Ranking From Previous Week” to learn which ETFs are moving up (gaining strength) or moving down (losing strength).
IMPORTANT DISCLAIMER: FollowtheMoney.com’s Weekend ETF Trend Alerts are provided solely for informational and educational purposes. They are NOT specific buy recommendations. For most members, this page will provide little more than entertainment value. But others may seek to replicate the trades made on this page. If so, you should know that trading stocks is risky and that it is possible to lose all of your trading capital. If you choose to trade, please know that you do so at your own risk. Jerry Robinson is not an investment advisor and does not provide specific stock investment advice. Always consult a trusted financial professional before making any investment decisions. Read full disclaimer.